
Soviet delivery systems and chemical agents wheel chart. Probably produced by one of the NATO countries.


I do not have in my collection.
Soviet delivery systems and chemical agents wheel chart. Probably produced by one of the NATO countries.
I do not have in my collection.
Filed under Calculators, Cold War, Cold War Calculators, History
First find your city
In the 1930s the advocates of aerial bombing thought that the strategic bomber would be the decisive weapon in any future war and that the bomber would always get through (and cause terrible destruction).
They were wrong; especially when it came to bombing Germany. In cloudy northern Europe it was hard to find targets and it was hard to bomb them accurately. The RAF’s Bomber Command tried daylight bombing and took such heavy losses that they had to change to night bombing. At night it was even more difficult to find targets. The RAF’s Bomber Command claimed to be aiming at specific factories in cities; in fact they were doing well if they could even find the city they were targeting.
Sometimes the bombers carried out effective raids, but in most cases they dropped their bombs on open fields (or the wrong target; even on the wrong country (Switzerland was bombed several times). The Bensusan-Butt report of 1941 indicated that only one in five of RAF bombers sent on a mission got within five miles of the target. On moonless or hazy nights it was one in fifteen. At this time Bomber Command was sending brave young men to die pointlessly over Germany.
Japanese air defences were so feeble that the USAF removed the guns from the bombers carrying out firestorm raids on Japanese cities. Germany air defences were very far from feeble. For example, the night fighter ace Heinz-Wolfgang Schnaufer, known as The Spook of St. Trond [he flew out of St Trond in Belgium] is credited with 121 kills, mainly British four engined bombers.

The tail fin from Schnaufer’s night fighter
Eventually, Bomber Command resorted to area bombing.This meant deliberately bombing cities with the objective of killing civilians and destroying their homes. Only cities were large enough to find and hit, though often the RAF bombers could not even find their target city in the dark due to high winds, heavy clouds and decoy sites.
The USAF thought that their heavily armed bombers could carry out daylight bombing. They could, but not without suffering unsustainable losses from German fighters. During the second raid on Schweinfurt the USAF lost 26% of their aircraft. To be sustainable and provide aircrews with a chance of surviving to the end of their tour losses had to average below 2%.
The Calculator
To be worth doing bombing had to be accurate. The calculator below was produced for the use of mission planners. Using it should have sobered those who thought that, even in ideal conditions, the accurate high altitude daylight bombing of industrial and military sites was easy.
For example, if you have an industrial site 70 ft by 1000 ft how many bombs must you drop to have at least an 80% chance of two of them hitting the target? The answer is 300. (I think that a uniform distribution has been assumed when calculating probabilities.)
The illustrative calculation [below] is not only sobering but also hopelessly optimistic because it uses a Circular Error of Probability (Aiming Error) of 1200 ft. Setting a CEP of 1200 ft assumes that at least 50% of the bombs would land within 1200 ft of the centre of the target. A CEP of one or two miles would have been more realistic for daylight bombing and four or five miles for night bombing.


The calculator shows that strategic bombing is not effective at hitting small targets. It also causes a lot of civilian casualties. If two out of 300 bombs land on a 70 x 1000 factory where do the others land? At the time workers often lived close to their work and the answer is they usually landed on houses.
Rockets
Tactical bombing could have provided a better way of attacking targets smaller than a city. Rocket firing British Hawker Typhoons (armed with eight 60 pound RP-3 rockets) and USAF Republic P-47 Thunderbolts were more likely to hit small targets and cause fewer civilian deaths. Especially friendly civilians. During the liberation of France Allied bombing killed 55,000 French civilians. That was more people than died in German’s bombing of Britain.
You can read about the bombing campaign in Europe in Professor Richard Overy’s The Bombing War.
Overview
Did strategic bombing achieve anything? It took pressure off the Russians by forcing the Germans to devote a significant amount of their resources to defending their cities. Also, when the Allies finally had long range fighters capable of escorting the bombers all the way into Germany they could force the German fighter arm to battle and were able to destroy it. A May 1944 raid by 886 bombers was accompanied by 735 fighters. The Americans lost seven fighters. The Germans lost 65.

Most importantly the destruction of German cities, mainly in the last few months of the war, demonstrated conclusively to Germans the costs of starting and losing a war. After WW1 Germany was not occupied and Hitler was able to claim that Germany had not really lost but had been betrayed. After area bombing levelled most German cities nobody could delude themselves that they had not really lost.
Filed under Calculators, History
This is the Tulloch Computer Mark 6 for the identification/use of chemical warfare agents. It is 4 inches/105mm in diameter and made of card.
It is a curious thing. I have yet to find any online reference to the Tulloch Computer and yet this is apparently version 6. What happened to versions 1 to 5? Who or what was Tulloch?
It is not as professionally made as some produced during the Cold War by some NATO countries and neither is it an amateur hand written production. It would have been cheap to produce which might suggest it was produced in large numbers. Its size suggests it was meant to be used in the field rather than at a desk.
I think somebody has put a plastic coating over parts of it. Presumably to protect it during use.
On its back there is some advice on the use of NAPS tablets and Combo Pens to treat the contaminated.
Some of the gases [e.g. mustard gas] were used in WW1. Sarin was available in WW2.
I suspect [on such little evidence] that it was produced in Britain for use by the army in WW2. However, it could have been made later for use in a conflict with a chemically unsophisticated opponent.
Please leave a comment if you have anything to add.


Filed under Calculators, Cold War, Cold War Calculators, History
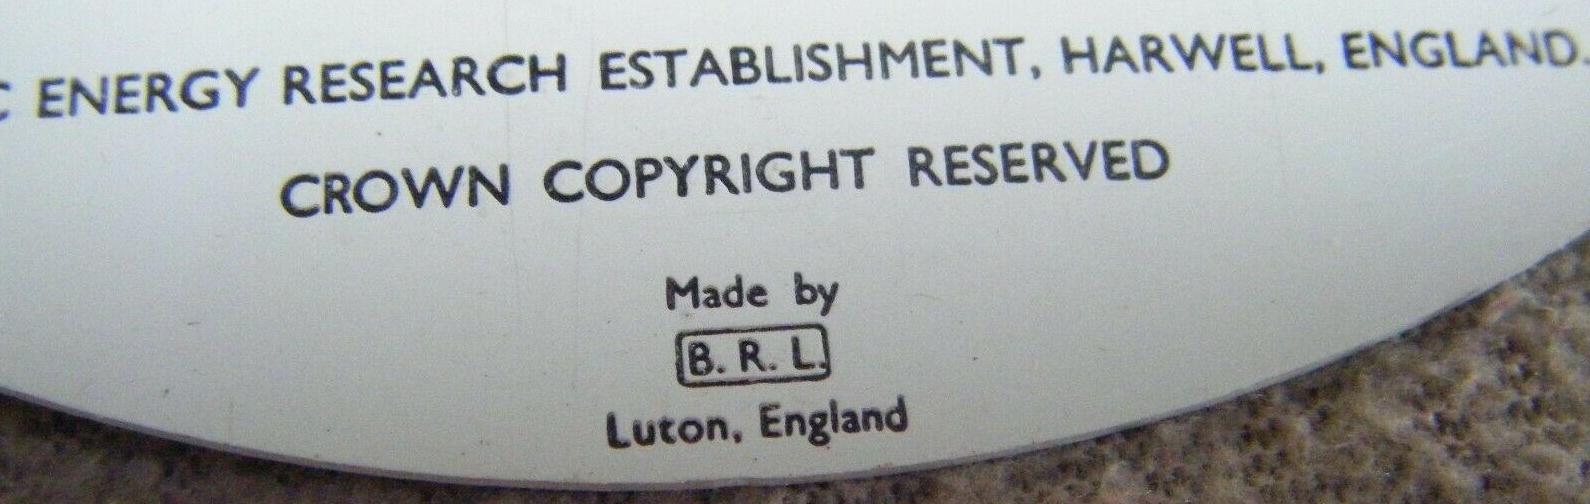
This calculator was produced by BRL Limited for the British government. It was designed by the Atomic Energy Research Establishment at Hartwell in England for issue to civil defence organisations.
The calculator is five inches [130mm] in diameter and consists of three plastic disks and a cursor. The one shown in the photographs was produced in 1963. I do not have a copy in my collection.


Filed under Calculators, Cold War, Cold War Calculators, History
The USA had two nuclear testing grounds during the early years of the Cold War. The Nevada Proving Ground was only 65 miles from Las Vegas. Most of the 928 tests of fission devices were under ground. The fallout from the 100 tests that were above ground [including the well named Dirt Harry test] are now believed to have caused between 300,000 and 600,000 cancer deaths in the USA.

Those are not molehills.
See this post for more information.
When the USA started testing fusion devices [hydrogen bombs] it needed to move to the Enewetok and Bikini Atolls in the Marshall Islands. The islands in the atolls already had names but most were difficult for Americans so each was given an alias.


Operation Redwing test shot on Bogon [aka Irene]

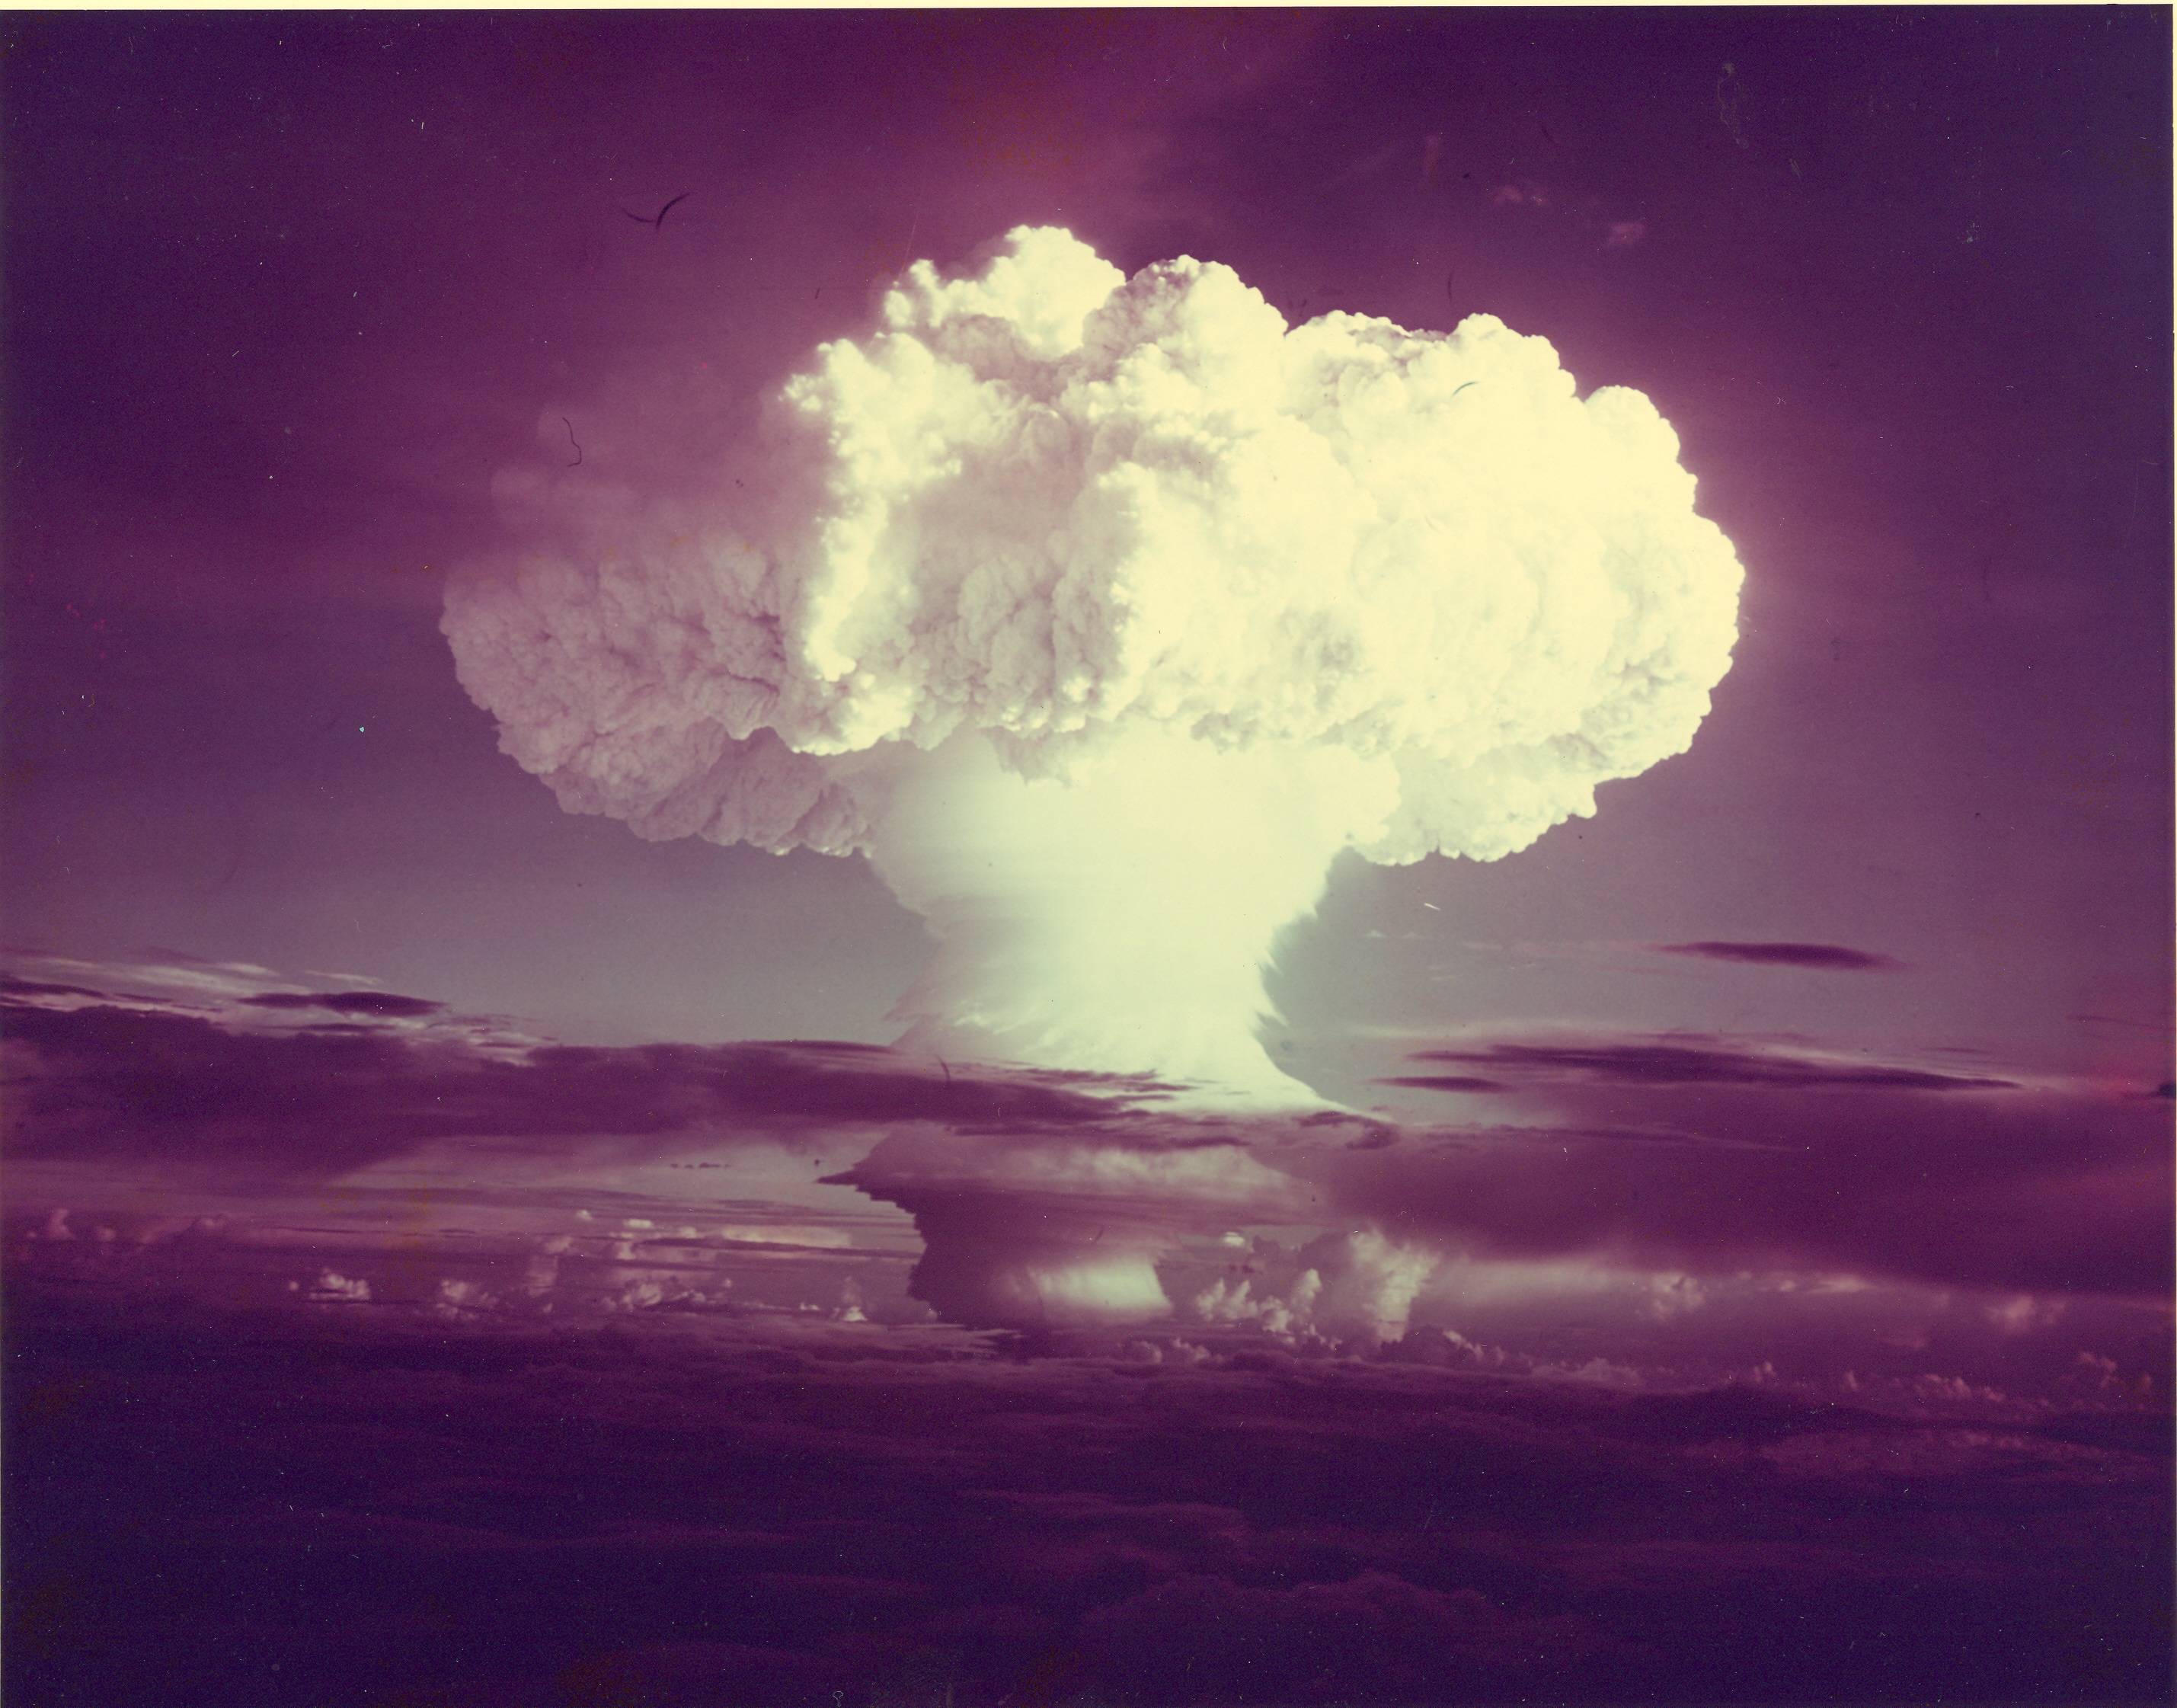
Flora [aka Elugelab]


The Umbrella test [part of Operation Hardtack] near Pokon [aka Irvin], Enewetak Atoll. An 8kt device detonated at a depth of 150ft.


Note the price of $1.75 for one computer. Peter Sellers was seen using one of these in the Dr Strangelove film. I think they were also given away to people attending some of the early performances of the film.
Filed under Calculators, Cold War, Cold War Calculators, History, Uncategorized
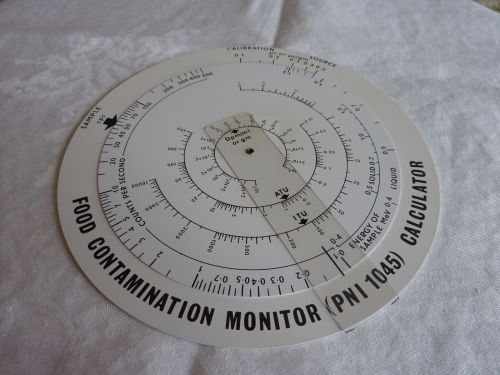
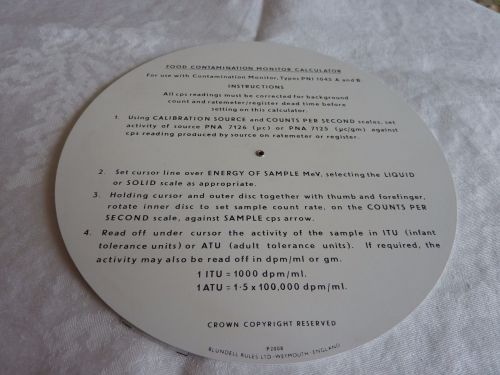
This calculator surfaced in Greece but is probably of US origin. No author information is shown but its reference number is 6LS-2820. Its purpose is to calculate the amount of a chemical agent required to saturate a target using a number of different delivery systems [e.g. 4.2″ mortar, howitser, rocket or 100 gallon airborne spray tank].

The back of the calculator refers to agent GB. That is the nerve gas Sarin.
The directions also refer to agent HD. This is mustard gas. Agent VX is the VX nerve gas. Under the UK’s Rainbow Code system VX had the code name “Purple Possum”.

The disk refers to the US Honest John and Sergeant missiles as possible delivery vehicles. Honest John was first deployed in 1953 [and remained in the NATO arsenal until 1985] but the M139 chemical weapon warhead was not available for the Honest John until the 1960s.

M139 warhead containing Sarin bomblets
The Sargeant missile was deployed in Europe from 1963. A chemical weapon warhead option was considered but the development project was cancelled in 1970.
The calculator consists of three disks. The largest is made of card and is just under 5″ [125mm] in diameter. It is fairly crudely made compared to the very high quality Cold War calculators later produced by Perrygraf.
Please leave a comment if you have any more information on this calculator.
Filed under Calculators, Cold War, Cold War Calculators, History, Uncategorized
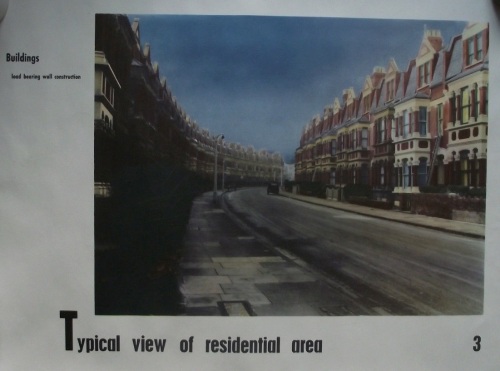
A set of posters produced by the Home Office Civil Defence department in 1958. The posters showed the effects of a nuclear attack on British cities. The posters were printed by the Hydrographic Supplies Establishment and sold for one pound, seven shillings and six pence.
The posters are 29 inches by 23 inches.


Eric Schlosser has a fascinating and frightening article [World War Three, by Mistake] in the New Yorker which describes how close we came to accidental annihilation during the Cold War, and how close we are to it now.
When the US public see their military idiots prodding the bear by posturing around Europe and wingnuts like Senator John McCain describe Putin as “a thug, a bully, and a murderer” they might want to think about what will happen if things go wrong and they prod too much.
The photo below shows a Russian Voevoda R-36M2 missile being loaded into a silo somewhere in Russia. Each missile carries up to ten warheads and up to 40 penetration aids to overwhelm enemy defences. Russian missile technology is much superior to that of the US and their missiles have a greater throw weight than US missiles like the Minuteman. That technical superiority is why the US has to buy rocket engines from Russia.
There are at least 46 R-36M2 complexes. Probably the US knows where most of are and could destroy most of them in a first strike. I very much doubt if it knows where all of them are and could destroy them all. If even one or two of them got out of their silos the US would become a third world country with ten or twenty of its largest cities destroyed. Don’t worry though, US senators and military commanders would be safe underground when the warheads arrived. Nobody important would be harmed.

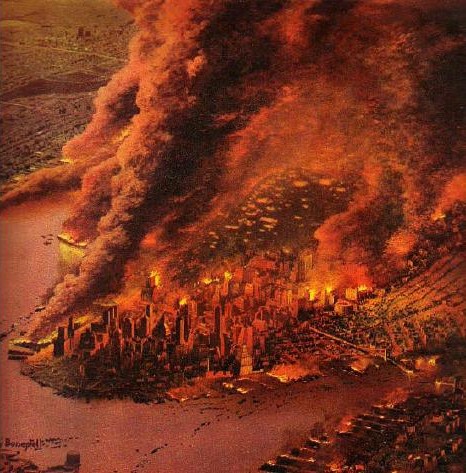
This post describes what would happen if a 800 kiloton warhead detonated over Manhattan.
The people of the Marshall Islands used a number of techniques to help them navigate between their 29 atolls and 5 islands. Such as following the seasonal navigation of birds, celestial navigation and noting the interferences in air and sea patterns caused by atolls. They might also have taken frigate birds with them. These birds will not land on the water as their feathers will become waterlogged making it impossible to fly. When the navigators thought they were close to land they could release a bird, which would either fly towards land, or return to the canoe if no land was in sight.
Doctor David Lewis’ ‘We, the Navigators: Ancient Art of Landfinding in the Pacific’ is the classic study of Pacific navigation techniques.
Probably most of the travel in the Marshall Islands took place between the islands in individual atolls. Bikini Atoll has 23 islands and the central lagoon is 229 square miles. Enewetok has 40 islands and a central lagoon 50 miles in circumference. Navigating even within a lagoon would not have been trivial.
Navigating between atolls would in most cases have been both difficult and dangerous. The area bounded by Bikini Utrik, Majuro and Ebon is 165,000 square miles. That is a lot of sea to get lost in. Travelling from Bikini to Enewetok involves a journey of 190 miles and if a navigator missed Enewetok it was a long way to the next land.
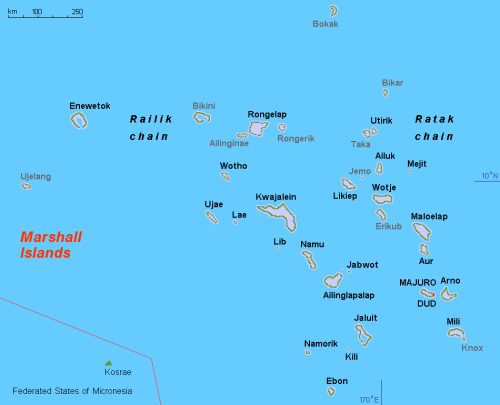
Navigators were important people who guarded their knowledge. They created stick charts to help them remember the direction of other atolls and the currents and swells that would affect their navigation. The charts consisted of sticks tied to create a frame and shells fastened to the frame to indicate atolls.
Some stick charts just showed [usually inaccurately] the direction and distance of some other atolls, like this 1884 specimen one from a Swedish Museum.
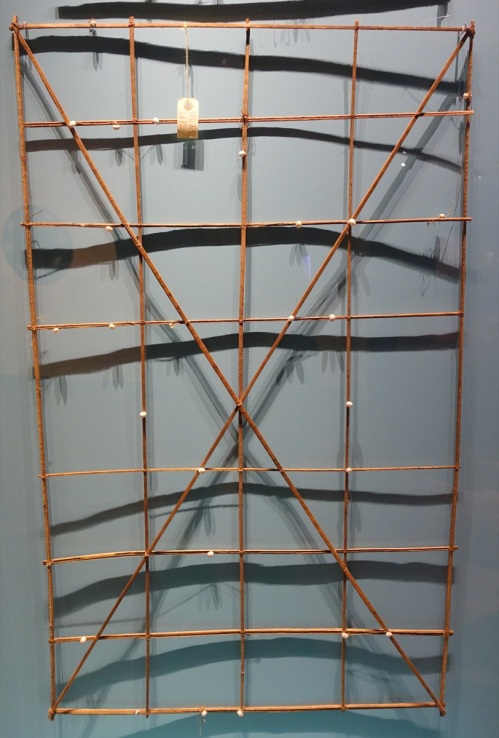
And this one from the Harvard University’s Peabody Museum.

Others also included sticks to indicate the flow of currents and swells.

Each navigator prepared his own stick chart and probably jealously guarded it from other navigators, just as sailing masters guarded the charts and notes in the early days of Western exploration.
During the Cold War the US used the Marshall Islands for testing nuclear weapons. The islands were designated as the Pacific Proving Grounds. See this post on the testing that took place there. There is also a stick chart that was made to illustrate the geography and identify the main atolls used for testing.
Filed under Misc
A rare British Cold War calculator. Presumably intended for use by civil defence after a nuclear attack.

Filed under Calculators, Cold War, Cold War Calculators, History
Tally sticks were once essential for recording government and commercial transactions. Kings used them to help collect taxes. Individuals and businesses used them provide a tangible record of debts and investments.
Tally sticks were usually made of wood, but could also be made of bone, ivory or stone. The Ishango Bone tally was made from the thigh bone of a baboon and dates from around 18000-20000 BC.
Tally sticks were introduced into England in about 1100 and continued to be used by Exchequer until 1827. In 1834 someone decided to dispose of the remaining sticks and succeeded in setting fire to the Houses of Parliament link.

Single tallies were usually used as a memory aid. Split tallies had a much wider range of applications. They were used to acknowledge receipt of goods, payment of taxes or a fine. Or, like the example below, provide proof of a debt. They formed part of a primitive but essential accounting system in medieval times.
Few tally sticks have survived [they made good firewood], so I made the one below to illustrate their features.
The stick is just under 12 inches long [about 30cm] and made of a wood with a clear grain. It records that AB owes CD five British pounds [£5], six shillings [6s] and three pence [3d]. Before decimalisation a pound was divided into twenty shillings and each shilling was divided into twelve pence. AB is the debtor [who owes the money] and CD is the creditor [who is owed]. It also shows when the debt is due. In the example repayment is due when CD demands it.
NN means non negotiable. CD cannot sell or give the debt to anyone else. AB will only repay CD. You can see the point of that. If CD sold the debt to an enemy of AB the enemy could bide their time and then present the tally when they knew AB was overstretched.

The notches in the top edge indicate value. There were different notches for pounds [and thousands of pounds], shillings and pence.
Sticks were made of woods that split easily so the one part of the split tally could be kept by the creditor and the other part taken by the debtor.

The creditor’s [CD] part was called the ‘stock’ and was longer than the ‘foil’ which was taken by AB. This is why we refer to someone getting the ‘short end of the stick’ when they have the worst part of a deal.
If someone lent money to the recently established Bank of England they would get a stock [from which we get the ‘stock’ in ‘stocks and shares’] recording the transaction. The Bank would keep the foil.
When we pay someone by cheque we send the cheque to our creditor but we keep a record of the payment on a ‘counterfoil’ in our cheque book.
Tally sticks had a number of anti-forgery features.
The two photographs below show another tally stick. I made this to resemble one that was used in Switzerland until the end of the 19th century and is now in a museum. The same anti-forgery features are present. The holes in each part were presumably drilled so that the tallies could be strung on a string and not mislaid or used as firewood by a housemaid. Thoughtless housemaids were a real danger. A maid burned Thomas Carlyle’s only copy of his book, the ‘The French Revolution: A History’, after mistaking it for waste paper and using it to kindle a fire.


After WW2 the USA needed to develop and test its nuclear technology. It set up two proving grounds.
The Nevada Proving Ground was only 65 miles from Las Vegas and gamblers could watch the mushroom clouds from the casinos and hotels. Most of the 928 tests were under ground but 100, including the notorious ‘Dirty Harry;’ test, were atmospheric. and winds carried the fallout of these to the west. The town of St. George was particularly badly affected and there were increases in leukaemia, lymphoma, thyroid cancer, breast cancer, melanoma, bone cancer, brain tumours, and gastrointestinal tract cancers. Over 200,00 cases of thyroid cancer were believed to have been caused [see this post]. Nuclear Test Participation certificates were issued to the people who took part in testing [see post]
Only low yield weapons were tested in Nevada. Most of the big bangs took place in the Pacific Proving Ground [1946-62], on the Enewetok and Bikini Atolls in the Marshall Islands. A few of the later tests were conducted on Christmas Island and Johnston Atoll.

A total of 105 atmospheric and underwater tests were conducted in the Marshall Islands. This was only 14% of the total number of tests but accounted for 80% of the megatonage, The estimated total yield of the Marshall Islands tests was about 210 megatons, including the 15 Mt Castle Bravo shot on Bikini in 1954. The Castle Bravo bomb got out of control and produced over twice the expected yield, spreading radioactive contamination over several of the Marshall Islands atolls and a large area of the Pacific.

The Marshall Islands are known for the stick charts charts their navigators created to help them sail between their 29 atolls and 5 islands. These are spread over a huge area of sea and navigation was a non trivial problem. I have made a stick chart to clarify the geography and identify the atolls that the USA used for military purposes. There is more about stick charts in a separate post.
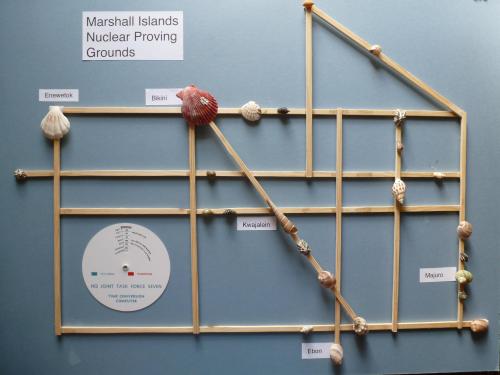
The Enewetok and Bikini [the swimsuit was named after the atoll] atolls were the ones used for testing. Kwajalien is still used by the USA as the the Ronald Reagan Ballistic Missile Defense Test Site. Majuro is the capital of the Marshall Islands. To give some idea of scale; it is 539 miles from Bikini to Ebon, the same distance as from London to Leipzig. The circular calculator in the bottom left is a Time Conversion Computer [see this post].
Testing began on Bikini in 1946 with the Crossroads tests Two 21 kiloton atomic bombs were detonated. ‘Able’ was an atmospheric test [video] and ‘Baker” an underwater test [video]. The Baker bomb was exploded at a depth of 27 meters in the middle of a small fleet of ex WW2 vessels. The dangers of radioactivity were not fully understood then and sailors were sent to try a scrub ‘clean’ the highly contaminated vessels.
Testing then moved to Enewetok Atoll for the Sandstone, Greenhouse and Ivy series of tests. After that testing took place on both Enewetok and Bikini until Operation Dominic in 1962 which involved 36 bombs being detonated above and near Johnston Atoll and Christmas Island.
Both Enewetok and Bikini remain heavily contaminated. Bikini is now a UNESCO World Heritage site. The natives of the Marshall Islands suffered form American operations in the Pacific Proving Ground, but not as badly as the natives of Utah and the mid west suffered from the operations in the Nevada Proving Ground.
The MSIG – 1 Multi-sigma slide rule was produced by the US Defense Nuclear Agency to assist military planners in calculating the probability of damage resulting from a nuclear detonation.

The rule is 8″ [205 mm] in diameter and produced by Perrygraf. It was designed by the DNA and is dated April 1987. This rule is very collectable but the hardest to find of all the DNA slide rules. The one shown was never issued and is in mint condition.


The MSIG -1 was the last slide rule to be produced by the DNA. After that they only supplied software for use on desktop and hand held machines. A list of the slide rule and software can be found in this post.
The complete package as issued consisted of a binder, hard cover, documentation, slide rule and two floppy disks.

Filed under Cold War, Cold War Calculators
The Defense Nuclear Agency was an offspring of the Manhattan Project and is now part of the Defense Threat Reduction Agency. In its various guises it had many responsibilities connected with America’s nuclear weapons programmes.
In the 1980s and 1990s it produced a series of calculators to help the military plan its nuclear attacks on targets in the USSR and other countries. The US had a list of target Vulnerability Numbers [see this post]. Planners could use these numbers and the DNA calculators to decide whether a bomber, a submarine launched missile or a ground launched missile be used against a target [they had different levels of accuracy] to achieve a specified level of damage and probability of success.
 The first calculators were circular slide rules, designed by the DNA and produced by Perrygraf. These rules are now both very collectable and very rare. A list of these rules is below.
 This blog has posts on all these. The list is incomplete because the DNA produced a Damage Prediction Rule VN – 1 in 1982 [see this post].
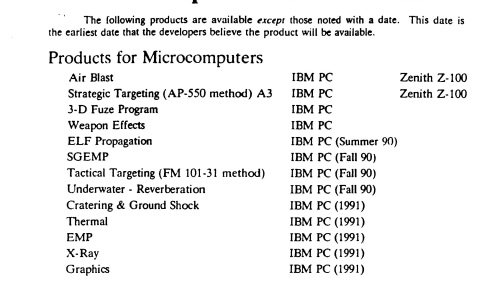
As soon as a introduction of the IBM PC created a technical standard for personal computers the DNA began producing nuclear targeting software programs. Some of the DNA’ss programs duplicated the functionality of the above slides rules. The Multi-sigma Damage Prediction Rule was produced as both a physical slide rule and as software programs for hand held and desktop machines. Programs for a long list of other targeting functions were added to the DNA catalogue.

Filed under Calculators, Cold War, Cold War Calculators, Uncategorized
